San Francisco Population and Migration: What the Numbers Say
San Francisco had an estimated 826,079 residents as of July 1, 2025 — about 6.0% below the April 2020 census base, against 0.5% for California as a whole. Here is what changed, where people went, who is arriving, and what the housing and household figures mean if you are planning a move in or out of the city.
The numbers, first
San Francisco had an estimated 826,079 residents as of July 1, 2025 — about 6.0% fewer than the April 2020 census base. California as a whole was down 0.5% over the same period, to 39,355,309.
The city shrank far faster than the state, then flattened. That gap is the whole story of Bay Area migration since 2020, and it is what people are really asking about when they ask whether San Francisco is emptying out.
A few figures that shape any decision to move here, all from the Census Bureau QuickFacts for San Francisco County:
- median household income: $140,970 (2020–2024, in 2024 dollars);
- median gross rent: $2,476;
- median value of an owner-occupied home: $1,394,500;
- homeownership rate: 38.2%;
- foreign-born residents: 34.0%;
- bachelor’s degree or higher: 60.3% of adults 25 and over;
- persons per household: 2.21.
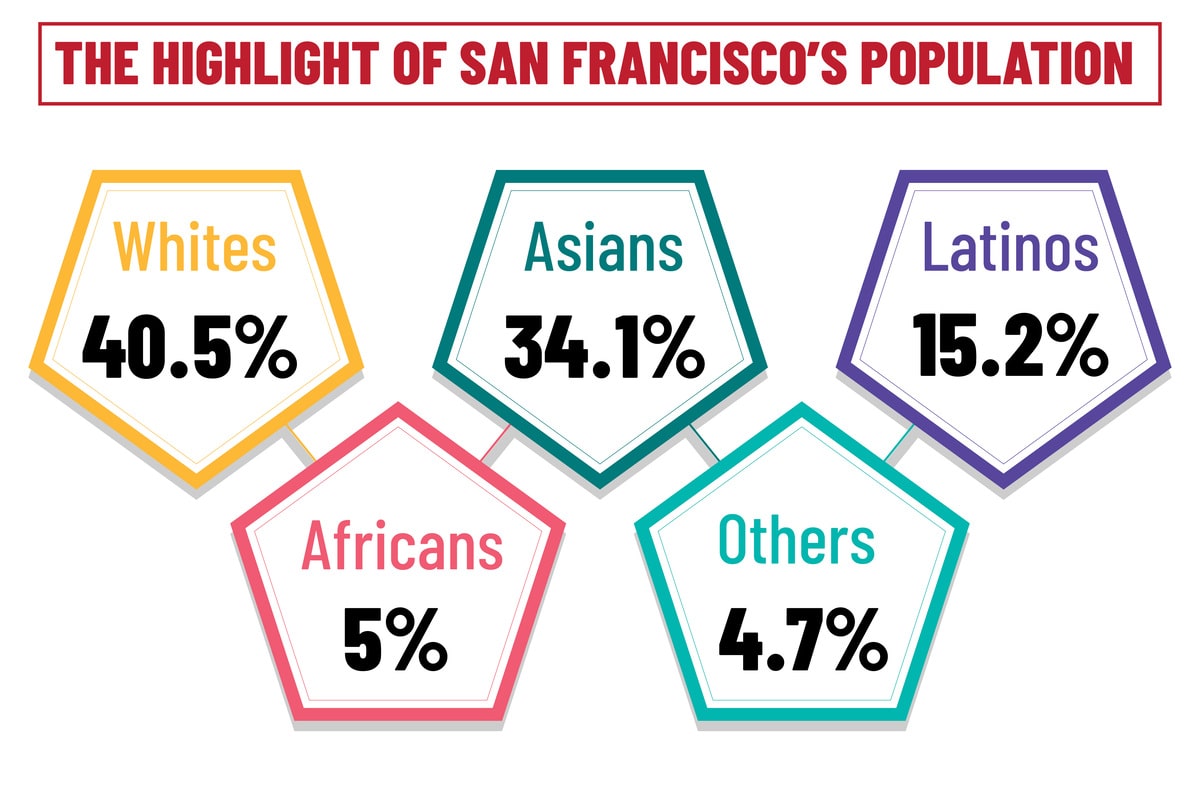
What actually happened after 2020
San Francisco lost population quickly in 2020 and 2021, more than almost any large American city in percentage terms. Three things drove it at once: remote work removed the reason to pay San Francisco rent, household formation shifted outward, and international arrivals — normally a large share of the city’s growth — stopped.
The decline slowed after that, and the composition of it changed. The people leaving were disproportionately households who could work from anywhere and wanted more space. The people arriving were, as before, younger, more likely to be foreign-born, and concentrated in a narrower set of neighborhoods.
Two things are worth separating when you read a headline about this. Net migration is not the same as the number of people moving in, and a city can lose population while individual neighborhoods gain it. San Francisco has done both at the same time.
Where people went
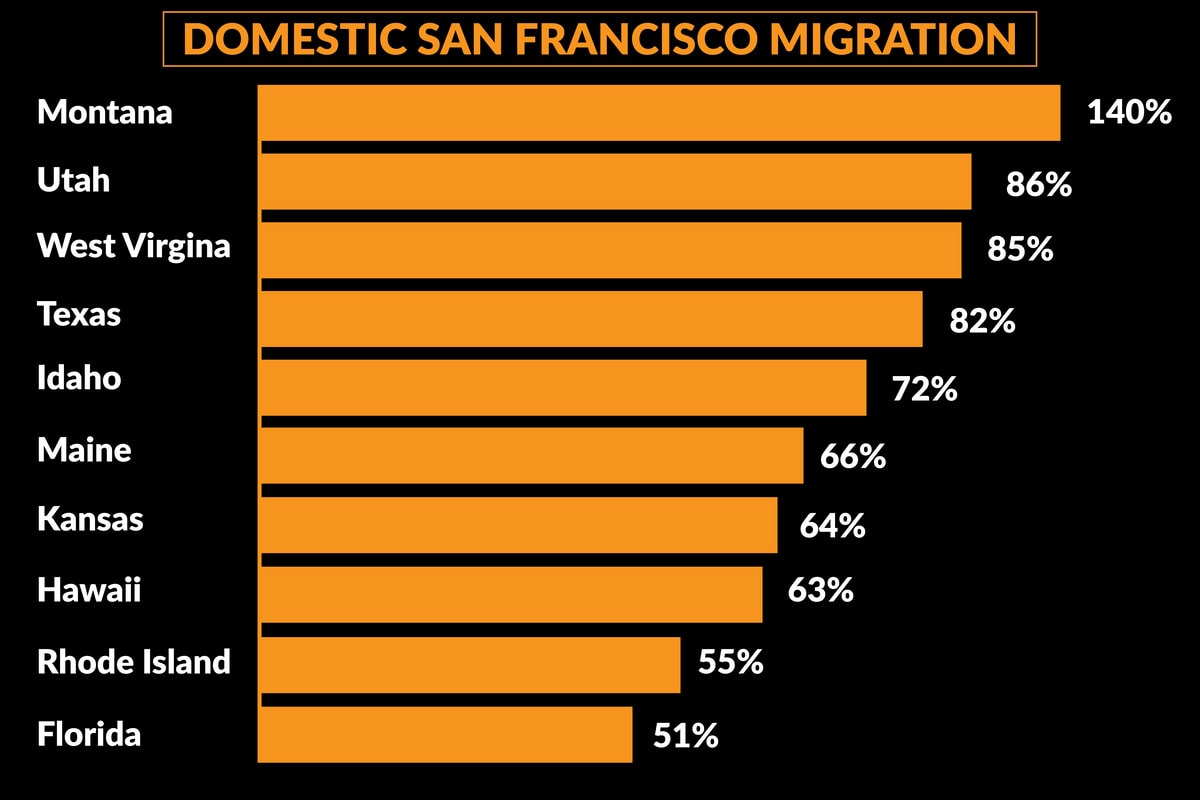
Most of the movement out of San Francisco stayed close. The common destinations fall into three groups:
- Within the Bay Area. The East Bay and the South Bay absorbed a large share — Oakland, Berkeley, Fremont, San Jose, and the Tri-Valley. More square footage, the same job market, a longer commute on the days there is one.
- Elsewhere in California. Sacramento, the Central Valley, and San Diego. Same state, materially lower housing costs.
- Out of state. Texas, Arizona, Nevada, Washington, Idaho, and Colorado, in roughly that order of volume over recent years.
We move all of these routes. See moving to Sacramento, moving to San Diego, moving to Seattle, and moving to Phoenix.
Who is moving in
Arrivals into San Francisco are not a cross-section of the country. They skew young, highly educated, and international.
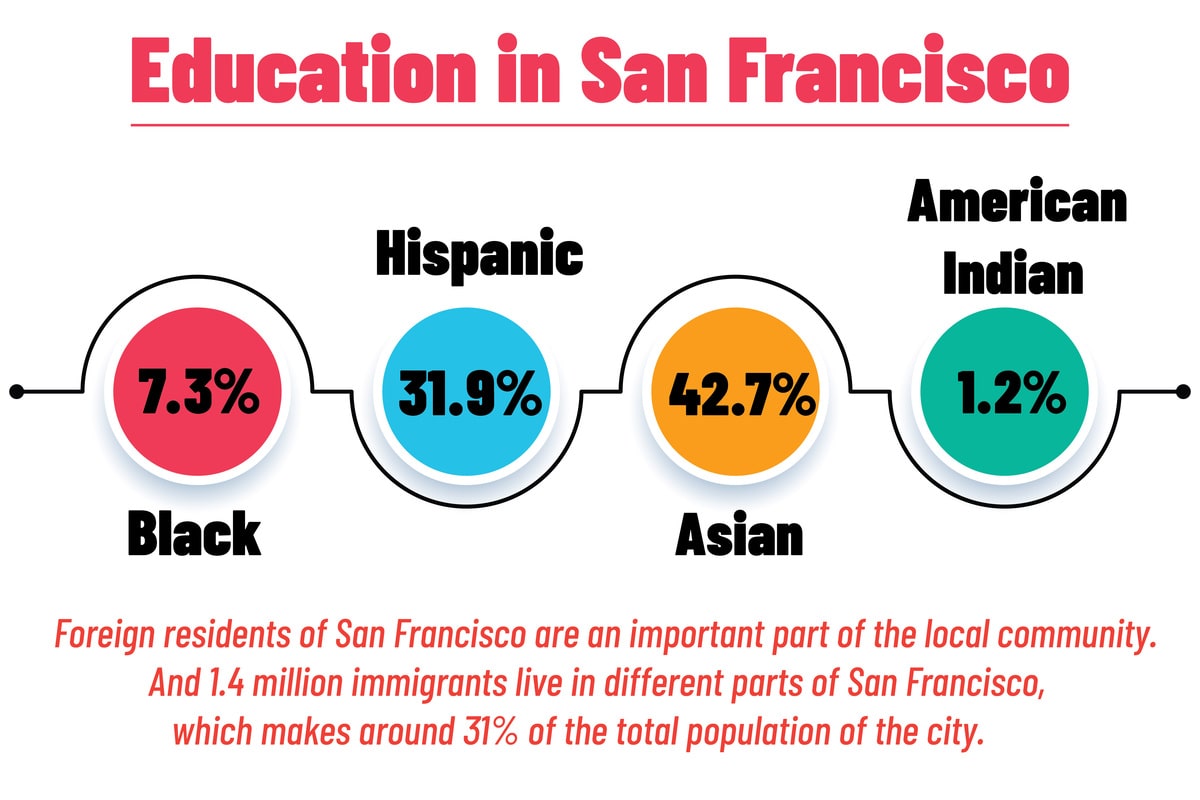
The Census figures tell you why the city feels the way it does: 34% of residents are foreign-born and 60.3% of adults hold a bachelor’s degree or higher. Both are far above the state and national levels, and both have held up through the population decline.
The practical consequence for anyone arriving is that the housing market is competitive at the top of the range and slow at the bottom. Median gross rent of $2,476 is a countywide figure that flattens enormous variation between a studio in the Excelsior and a two-bedroom in Hayes Valley.
The Bay Area, not just the city
San Francisco is under a million people. The nine-county Bay Area is several times that, and for most people the real decision is which part of it to live in rather than whether to be in the city.
San Jose is the largest city in the region by population. Oakland is the cheaper urban option with the best transit connection to San Francisco. The Peninsula sits between the two job centers and prices accordingly. The Tri-Valley and the North Bay trade commute time for space.
If you are weighing these, our guides go into each: moving to the Bay Area, moving to San Jose, best places to live in San Francisco, and cost of living in San Francisco.
What the jobs picture means for a move
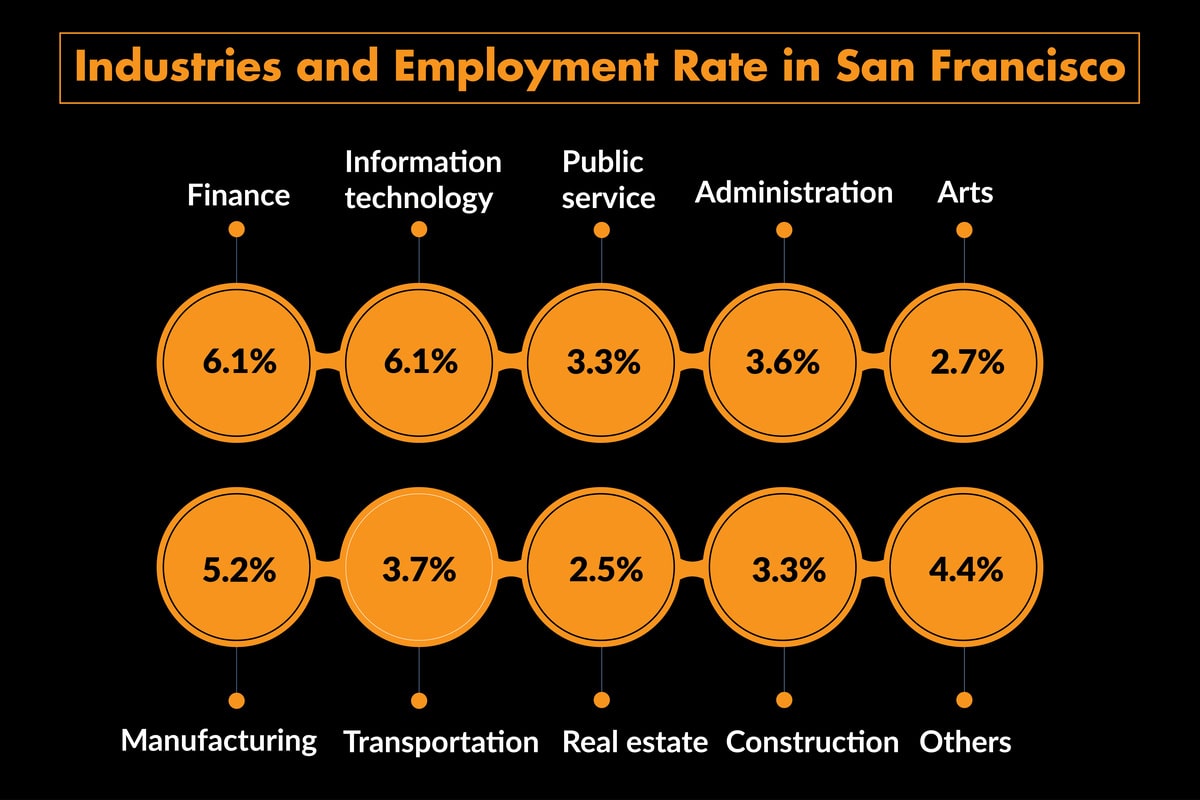
The city’s employment is concentrated: technology, finance, healthcare, higher education, tourism, and professional services. That concentration is why incomes are high and why the housing market reacts so quickly to a single sector.
For someone planning a relocation, the practical question is not the citywide number but the commute. A job in SoMa and a job in Palo Alto point at completely different neighborhoods. Decide the commute first, then the neighborhood, then the apartment.
What the population numbers mean for your move
Statistics are interesting; the operational consequences are what change your plan.
- Housing stock is old and vertical. 421,342 housing units, a large share in pre-war multi-unit buildings with narrow stairwells, no elevator, and tight doorways. Measure your furniture before you sign.
- 2.21 persons per household means small units. A three-bedroom worth of furniture rarely fits a San Francisco one-bedroom, and the sorting is better done before the move than after.
- 38.2% homeownership means most moves here are rentals, which means lease dates, deposits, elevator reservations, and certificates of insurance.
- Curb space is the constraint. Hills, narrow streets, and permit parking mean the truck position has to be planned rather than assumed.
These are the details that decide how long a move takes in this city. See moving in San Francisco and apartment moving for how each is planned.
Reading population data without being misled
Three habits are worth having when you see a number in a headline.
- Check the geography. San Francisco city and county are the same 47 square miles. The Bay Area is nine counties. The metro area is something else again. Numbers get swapped between them constantly.
- Check the date. Estimates are revised, and a 2021 figure describes a different city than a 2025 one.
- Check the source. The Census Bureau, the California Department of Finance, and private data vendors all publish different figures using different methods.
For the primary figures, go to Census QuickFacts directly. It takes a minute and it is the number everything else is derived from.
Planning a move in or out of San Francisco
California Movers USA is based in San Francisco and moves in both directions daily — within the city, across the Bay Area, and out of state.
What matters here is access rather than distance. A sales specialist confirms the inventory and the building conditions, a dispatcher books the elevator window and the curb, and a lead foreman runs the day. The crews are in-house employees, not subcontracted labor.
See local moving for moves inside the Bay Area, state-to-state moving if you are leaving California, and pricing for how a written scope is built. To start, tell us what you are moving.
Questions people ask
What is the population of San Francisco?
An estimated 826,079 as of July 1, 2025, according to Census Bureau QuickFacts.
Is San Francisco losing population?
It lost about 6.0% between April 2020 and July 2025, far more than California’s 0.5%. The steep decline was concentrated in the first two years and has since flattened.
Where do people move when they leave San Francisco?
Mostly not far: the East Bay, the South Bay, and elsewhere in California. Out-of-state moves go primarily to Texas, Arizona, Nevada, Washington, and Idaho.
How expensive is it to live in San Francisco?
Median gross rent is $2,476 and the median owner-occupied home value is $1,394,500, against a median household income of $140,970. See our cost of living guide.
How diverse is the city?
34.0% of residents are foreign-born, well above the state and national figures.
Is the Bay Area growing again?
The regional picture is mixed by county and revised regularly. Check the current Census estimate rather than an older article — including this one.
Figures from U.S. Census Bureau QuickFacts, reviewed September 2026.